Technical Analysis – Dollar Australian, NZD/AUD, EUR/AUD, Talking Points: Moving Averages, Range, and Reversal
- For the time being, the Australian dollar is still range-bound against the EUR and NZD.
- Despite certain parallels, every currency pair has distinct characteristics.
- Triangles, momentum, and retracements could all serve as markers.
Technical Analysis of EUR/AUD
For the past four months, the EUR/AUD pair has been trapped between 1.6200 and 1.7100, and it may be in range trading mode at the moment. To gain additional insight into range trading, click the banner that follows.
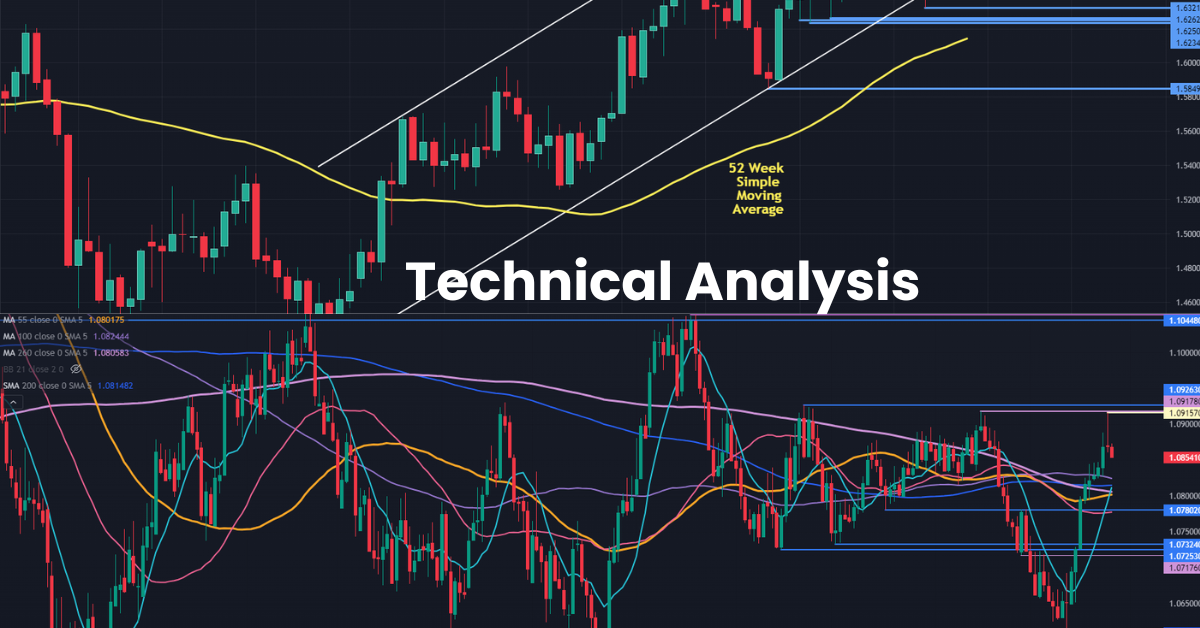
This week, the price has had difficulty rising above the recent highs, which were slightly below 1.6900 on Monday when it peaked at 1.6845. A second retest of those levels could provide resistance before the 2-year high at 1.7065.
The 100-day Simple Moving Averages (SMA) at 1.6550, which the Wednesday decline stopped short of, could offer support in the event of another sell-off.
A possible support zone in the range of 1.6235 and 1.6265 could be found further down, with support possibly located at the previous lows at 1.6445 and 1.6320.
Weekly Technical Analysis of EUR/AUD
When we enlarge the weekly chart, we can see that EUR/AUD is still in an ascending trend channel.
Since the trend began to emerge in September 2022, the price has been trading above the 52-week SMA. The trend may have reached its limit if there is a cross below this SMA.
Technical Analysis of AUD/NZD
A reversal may be in the works based on the Spinning Top Candlestick that was displayed in yesterday’s price action.
The 1.0916 peak from yesterday was only marginally higher than the 1.0918 and 1.0926 peaks from September and July, respectively. Before a possible resistance zone close to 1.1050, this area might provide resistance on a rally.
Weekly Analysis of AUD/NZD
The AUD/NZD exchange rate has formed a symmetric triangle due to the range’s narrowing.
It is currently trading above the triangle’s upper edge, and if it closes above the descending trend line, that could indicate a breakout and the start of bullish momentum.
It may turn out to be a false break and the triangle formation would remain intact, possibly indicating a reversal, if it closes below the descending trend line.


